


Next: Visualization of critical points
Up: Summary
Previous: Stream arrows
Dynamical systems often exhibit cyclic or quasi-cyclic behavior,
e.g., food chains, oscillating chemical reactions, weather models
based on the period of one year, etc. The cyclic property of such
systems usually dominates the character of the behavior.
Since the periodic
or quasi-periodic behavior usually is known in advance, the local
changes turn after turn are much more interesting.
In cases like these Poincaré maps, a technique used by
mathematicians, becomes useful. A
planar cross-section, called the Poincaré section, is placed
orthogonal to the periodic flow. Consecutive intersections of flow
trajectories are related via the Poincaré map, i.e., a discrete
dynamical system of one dimension less than the cyclic flow. This
Poincaré map inherits many
important properties from the periodic or quasi-periodic flow.
See Fig. 5.1 for an illustration of this
relation between the 3D flow and its 2D Poincaré map.
The visualization of periodic or quasi-periodic dynamical systems
can be done on the basis of Poincaré maps. Several
possibilities are given:
Visualizing
 -
-
- A direct visualization of Poincaré map
p is to
visually correlate
x and
p(x). This
can be done by placing small arrows on the Poincaré
section with the tail aligned with
x and the
head coinciding with
p(x). See
Fig. 5.4 for a visualization of a non-linear
saddle cycle where this technique was used.
Visualizing
 -
-
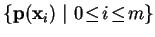
- Instead of plotting a rather small number of arrows for a
discrete set of pairs
(xi,p(xi)), a
continuous representation of
by the use of
adapted spot noise can be used. Elliptic spots are placed on
the spot noise texture such that the focal points of the
ellipses coincide with
x and
p(x).
Using a high number of spots a direct representation of
continuous
is achieved (see
Fig. 5.6).
Visualizing
 -
-
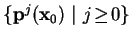
- Often the long-term behavior of a dynamical system is of
special interest. Thus the visualization of the repeated
application of Poincaré map
p is also very important.
Instead of showing many arrows representing one
application of
p to many points of the Poincaré section,
,
i.e., the repeated
application of
p to one specific initial condition is
represented. The discrete orbit can be shown, for instance,
as set of small spheres. See again Fig. 5.4,
where a few orbits are included to visualize the long-term
evolution induced by the dynamical system.
Visualizing
pq instead of
p1 -
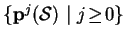
- Sometimes, the investigation of
pq is more useful than
visualizing
p itself. Usually this is the case, if a
q-loop cycle, i.e., a cycle that closes after q revolutions, dominates the behavior of the dynamical
system. Visualization on the basis of Poincaré maps
should take this into account (see
Fig. 5.8).
Visualizing
 -
-
- Using animation even the repeated application of Poincaré
map
p to the continuous sub-sets of Poincaré section
 ,
i.e.,
,
i.e.,
 ,
can be
visualized. For efficiency reasons, a texture on sub-set
is transformed using a warp approximation of
p in discrete time steps for each
application of
p. The vectors of the warp approximation
are derived from the Poincaré map
p.
,
can be
visualized. For efficiency reasons, a texture on sub-set
is transformed using a warp approximation of
p in discrete time steps for each
application of
p. The vectors of the warp approximation
are derived from the Poincaré map
p.
Adding Flow Visualization -
- It is also helpful to combine Poincaré section
visualization with flow visualization. The relation
between Poincaré map and continuous flow is depicted.
This helps to keep the periodic or quasi-periodic structure
in mind when investigating the Poincaré map (see
the figure on page
![[*]](cross_ref_motif.gif) ).
).
Next: Visualization of critical points
Up: Summary
Previous: Stream arrows
Helwig Löffelmann, November 1998, mailto:helwig@cg.tuwien.ac.at.