Figures - overview - Chapter 7

Figures - overview - Chapter 7 | |
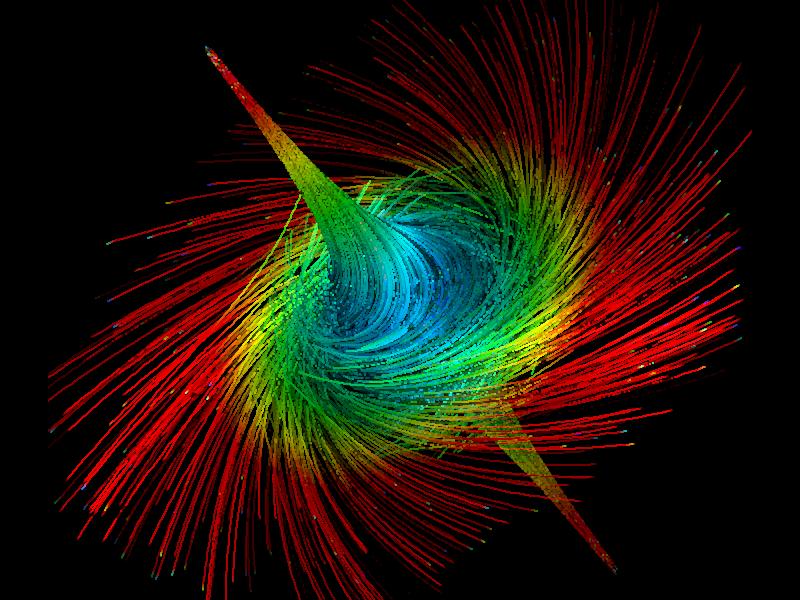
| 1094-focus.1-4.jpg |
| (image on first page of Chapt. 7) | |
| 1095-model-a.gif |
| Figure 7.1: Relation between streamlet density (
| |
| 1096-d-2.gif |
| Figure 7.2: Probability density function
| |
|
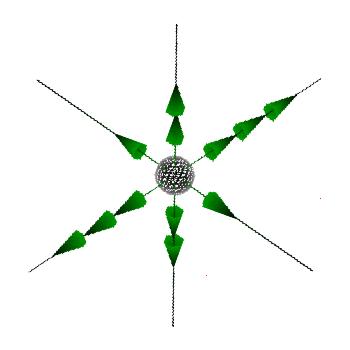
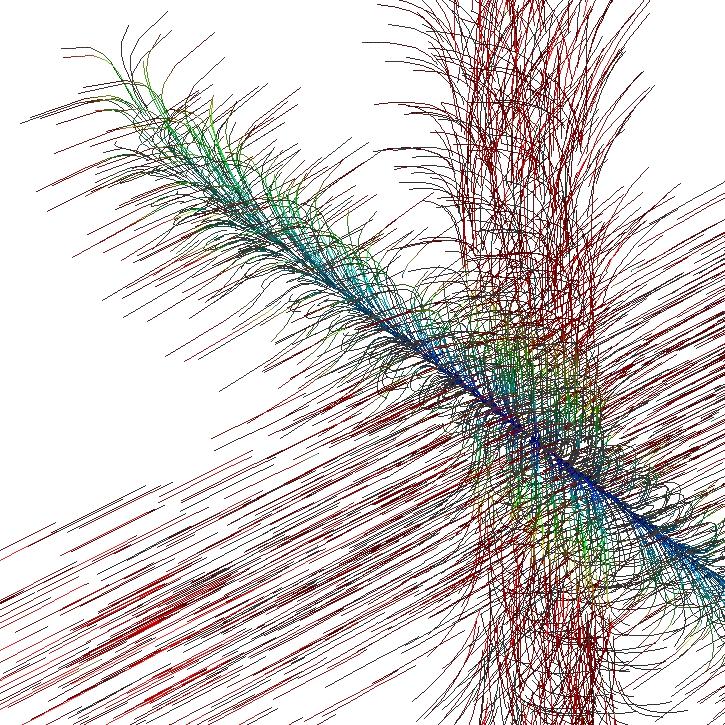
1097-realfp.chardir-4.jpg, 1098-realfp.2e.jpg |
| Figure 7.3: Visualizing the flow near a linear node repellor in 3D: (a) eigenvectors and eigenvalues, (b) characteristic trajectories plus threads of streamlets. | |
|
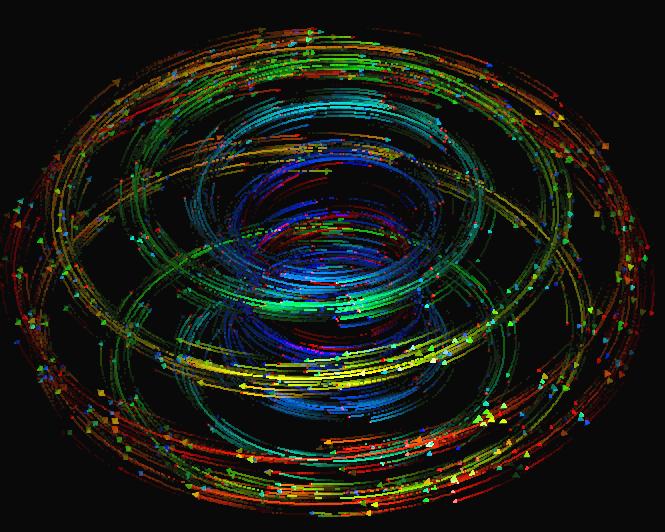
1099-rtorus.2-5.jpg, 1100-focus.1-4.jpg |
| Figure 7.4: (a) A thread of streamlets visualizing the flow near a torus in 3D. (b) Flow near a 3D focus visualized using two threads of streamlets. | |
|
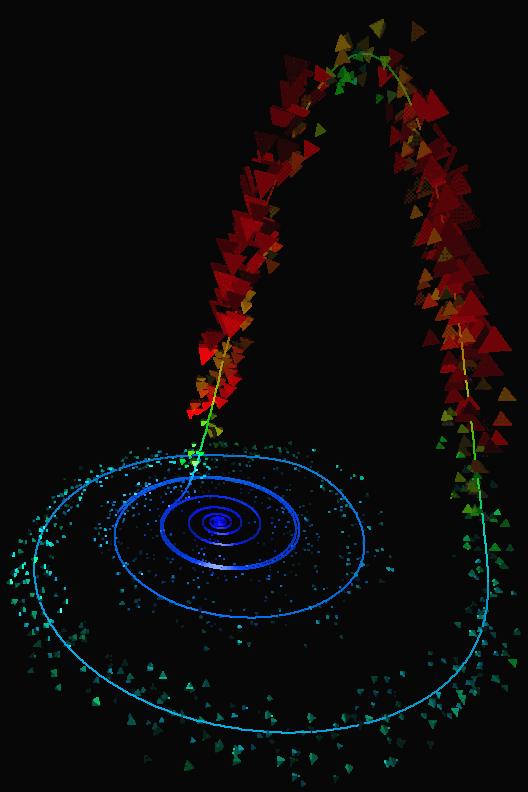
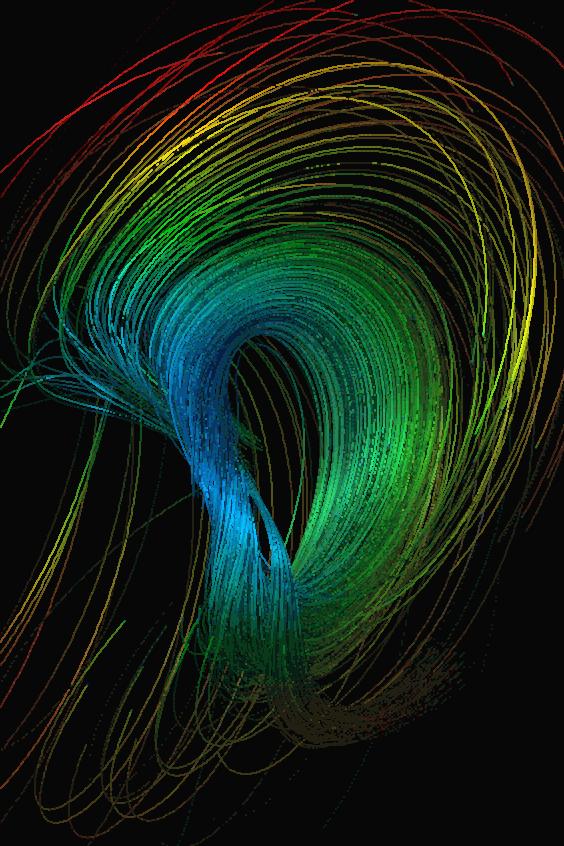
1101-roessler.1-6.jpg, 1102-rtorus.1-6.jpg |
| Figure 7.5: (a) Visualizing the flow velocity near a stream line of the Roessler system. (b) Visualizing the dynamics of a periodic dynamical system exhibiting a twisted torus. | |